Observability
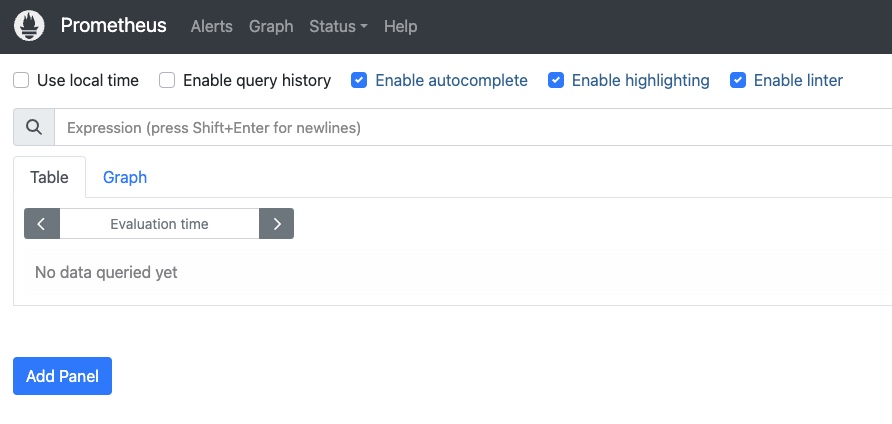
Prometheus
Istio generates metrics based on the four golden signals: latency, traffic, errors, and saturation.
Latency represents the time it takes to service a request. These metrics should be broken down into latency of successful requests (e.g., HTTP 200) and failed requests (e.g., HTTP 500).
Traffic measures how much demand gets placed on the system, and it’s measured in system-specific metrics. For example, HTTP requests per second, or concurrent sessions, retrievals per second, and so on.
Errors measures the rate of failed requests (e.g., HTTP 500s).
Saturation measures how full the most constrained resources of service are. For example, utilization of a thread pool.
Metrics are collected at the Envoy proxy, service and control plane.
kubectl apply -f samples/addons/prometheus.yamlkubectl -n istio-system get deploy prometheusNAME READY UP-TO-DATE AVAILABLE AGE
prometheus 1/1 1 1 52sistioctl dashboard prometheusThe Prometheus UI opens in a browser

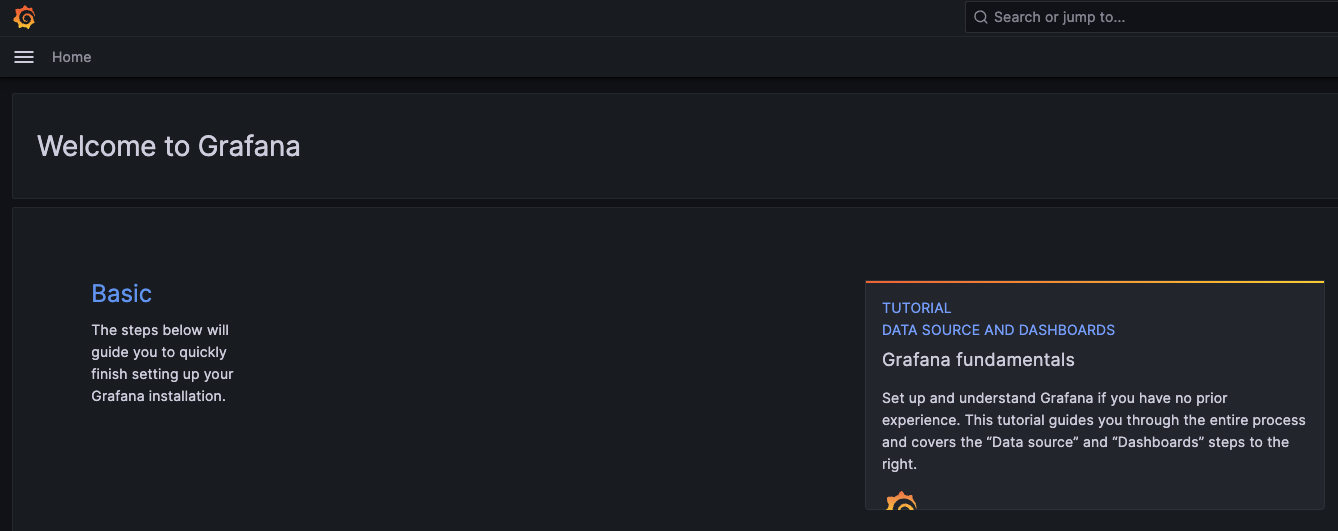
Grafana
Grafana is an open platform for analytics and monitoring. It connects to Prometheus (and other sources).
kubectl apply -f samples/addons/grafana.yamlkubectl -n istio-system get deploy grafanaNAME READY UP-TO-DATE AVAILABLE AGE
grafana 1/1 1 1 63sistioctl dashboard grafanaThe Grafana UI opens in a browser

Zipkin
Tracing helps to follow the requests as they travel through the different pieces of the system being monitored.
A trace is a collection of spans.
Traces you get with Istio service mesh get captured at the service boundaries. To understand the application behavior and troubleshoot problems, you need to instrument your applications by creating additional spans properly.
kubectl apply -f samples/addons/extras/zipkin.yamlkubectl -n istio-system get deploy zipkinNAME READY UP-TO-DATE AVAILABLE AGE
zipkin 1/1 1 1 24sistioctl dashboard zipkinThe Zipkin UI opens in a browser

Kiali
Kiali is a management console for Istio-based service mesh. It provides dashboards, observability and lets us operate the mesh with robust configuration and validation capabilities. It shows the service mesh structure by inferring traffic topology and displays the health of the mesh. Kiali provides detailed metrics, robust validation, Grafana access, and strong integration for distributed tracing with Jaeger.
kubectl apply -f samples/addons/kiali.yamlkubectl -n istio-system get deploy kialiNAME READY UP-TO-DATE AVAILABLE AGE
kiali 1/1 1 1 34sistioctl dashboard kialiThe Kiali UI opens in a browser
